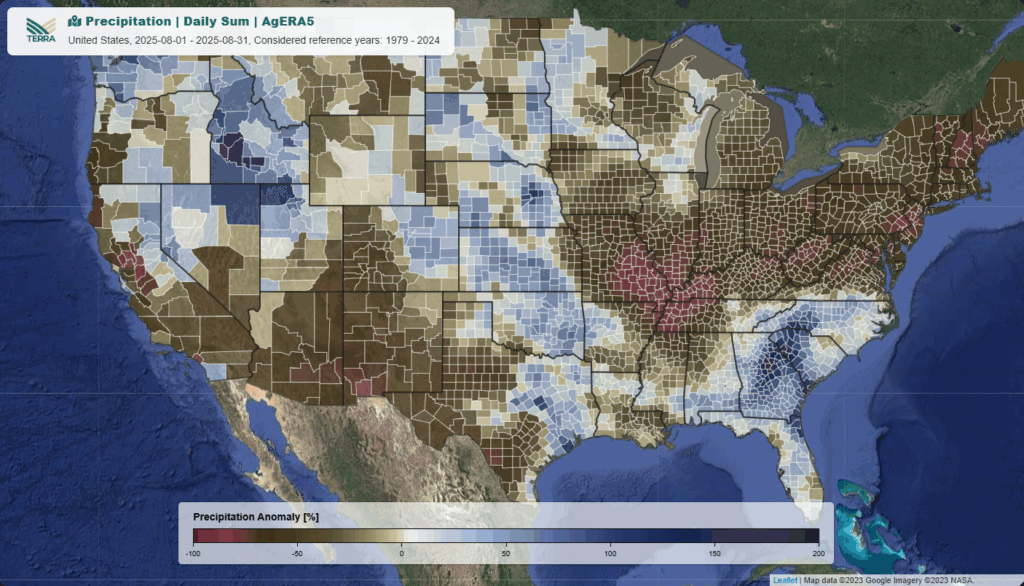
Extremely Dry August Grips Southeastern Corn Belt
Growing conditions across much of the eastern Corn Belt turned severely dry in August 2025, marking a dramatic reversal from the previous month’s abundant rainfall. While many counties experienced significantly above-average precipitation in July, Figure 1 shows that August 2025 ranked among the driest August months for decades across key agricultural regions in the Midwest. Missouri and the southern portions of Illinois and Indiana have been hit particularly hard, experiencing their driest August conditions since 1979 .
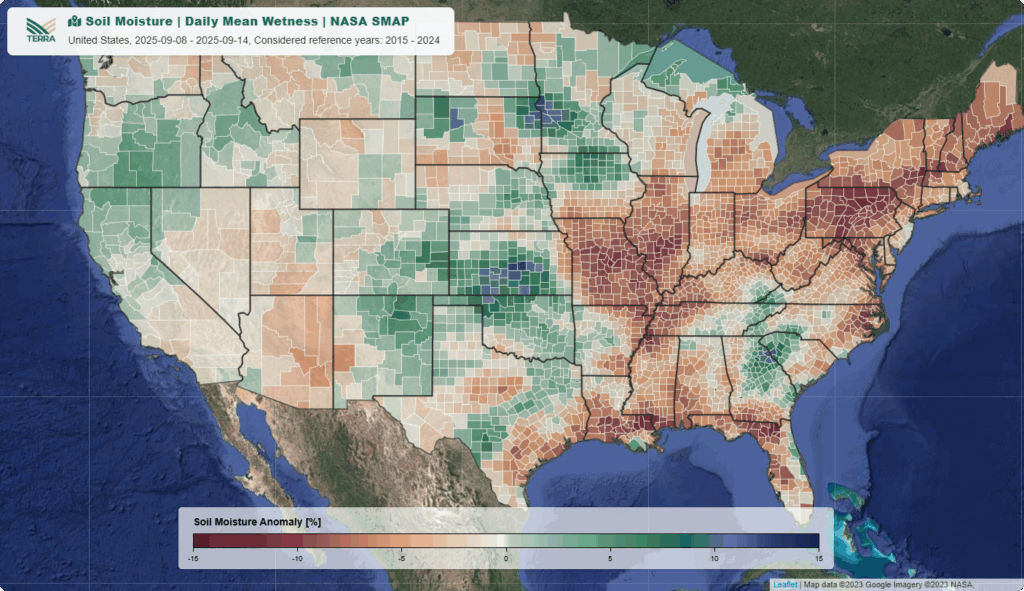
Despite the favorable soil moisture levels that carried over from July’s heavy rains, the prolonged dry spell is now beginning to impact soil moisture conditions (see Figure 2).
Can a Dry August still Impact Crop Yields in the Corn Belt States?
While research consistently shows that June and July precipitation has the greatest overall impact on corn yields across the Corn Belt, our own analysis indicates that August moisture plays an equally crucial role in determining final production levels. June and July rainfall largely establish the crop’s yield potential, but August weather determines whether that potential can be realized.
During August, corn enters usually its grain-filling phase, when kernels accumulate the dry matter that determines final weight and quality. Adequate moisture during this period is essential for maximizing yields, as water stress can trigger kernel abortion and reduce grain weight. When August drought coincides with high temperatures, the dual stress can cause yield losses of up to 50 percent, even when earlier growing conditions were favorable.
Which Regions are Most Affected by Precipitation Deficit in August?
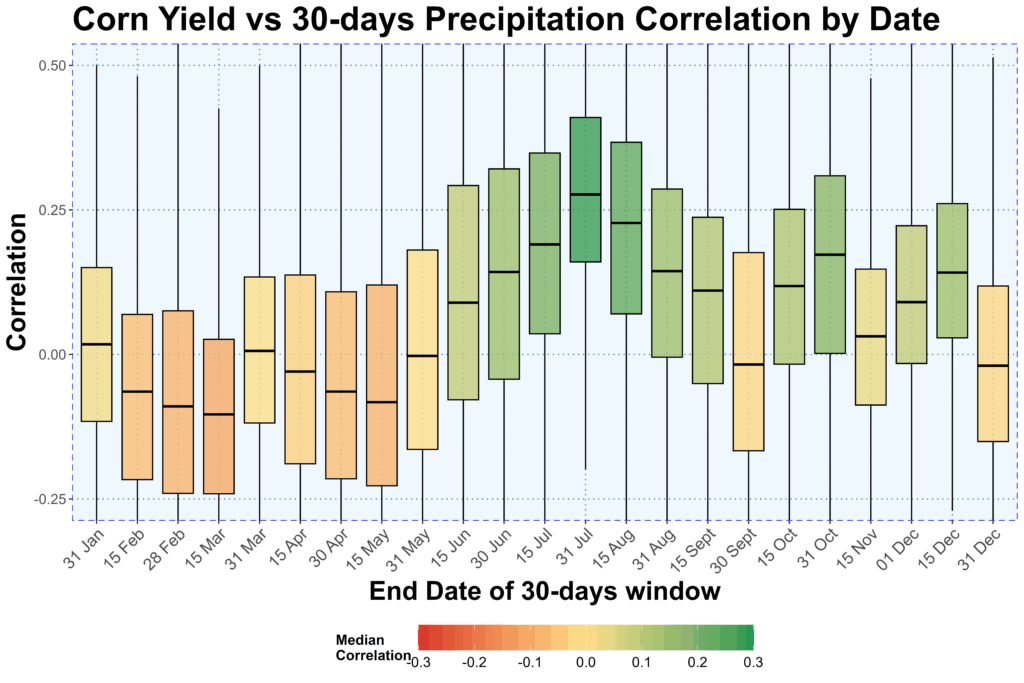
Using precipitation data from the TERRA ClimateExplorer, we quantify the impact of 30-days windows on final crop yields on a county level for twelve Corn Belt States. Figure 3 shows the coefficient of correlation between the sum of precipitation of a given 30-days window with the final corn yields. As expected, most counties show the highest average correlation between precipitation and corn yields during the 30-day precipitation window ending July 31st.
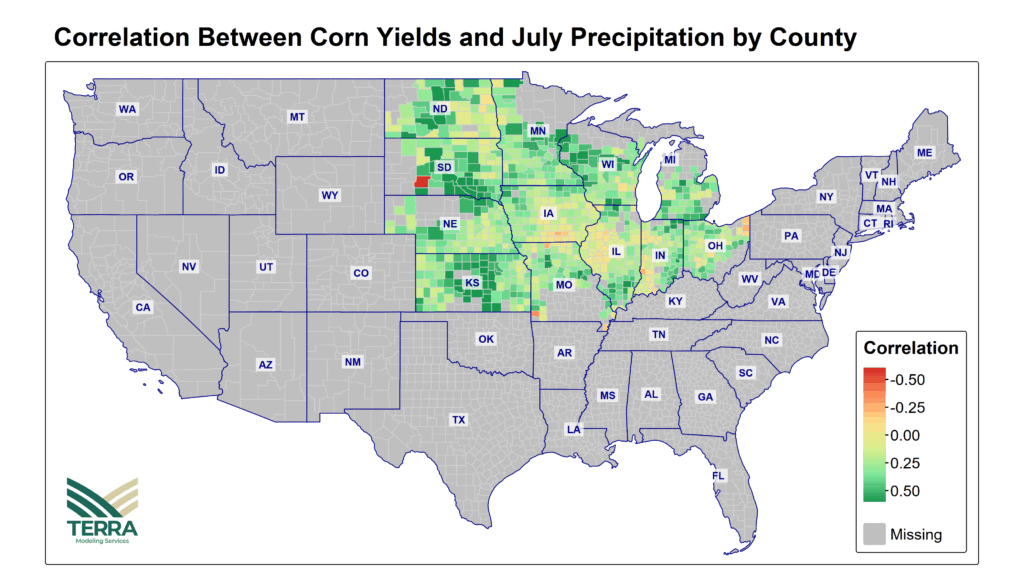
The spatial distribution of correlation coefficients reveals important regional patterns in precipitation-yield relationships. Figure 4 shows the correlations between final corn yields and July precipitation at the county level. The strongest positive correlations appear across the northern Great Plains, as well as in central Kansas and northern Wisconsin. These regional clusters suggest that July moisture is particularly critical for corn production in areas where summer precipitation timing aligns with key developmental stages, such as pollination and early grain filling.
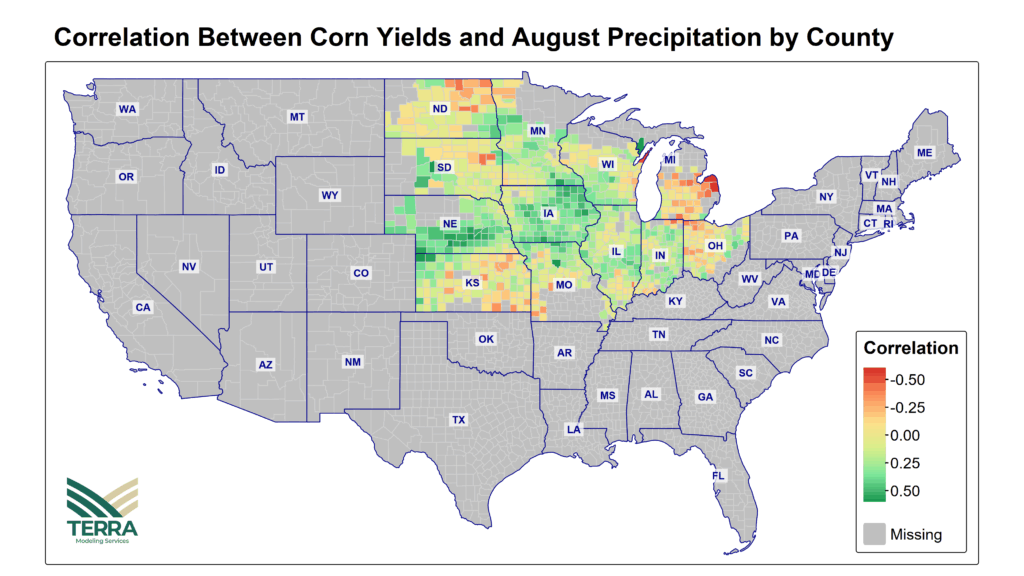
When examining August precipitation patterns, the correlation landscape shifts significantly (see Figure 5). August precipitation shows much stronger positive correlations with final corn yields across the core Corn Belt states of Iowa, central Illinois, and Indiana. This regional shift reflects the critical timing of grain filling, when adequate moisture becomes essential for kernel development in these highly productive agricultural areas. Conversely, in the northern Great Plains, August precipitation shows weaker correlations and we even find negative relationships in some counties in Kansas, Missouri and Ohio, suggesting that excessive late-season moisture may interfere with crop maturation in these regions.
2025 Record Production Forecast Faces September Weather Headwinds
In its September report, USDA revised upward its corn production estimate by 72 million bushels to a projected record of 16.814 billion bushels (see here). While the agency modestly reduced the national average corn yield forecast from 188.8 bushels per acre in August to 186.7 bushels per acre in September, this projection would still represent the highest average corn yield in US history. Special attention will be needed in Iowa, where rainfall was far below average in August and where many counties show strong relationships between corn yields and August precipitation. The continued dry conditions across core Corn Belt states during the first half of September will likely influence USDA’s yield assessments in the upcoming October Crop Production report, making it a closely watched release for market participants and agricultural stakeholders.
Want to run your own crop or weather analysis?
With the #TERRAClimateExplorer, accessing agro-meteorological insights has never been easier. The #TERRAClimateExplorer is a web-based solution that enables you to gather, monitor, and visualize historical and real-time weather and remote sensing data for any location worldwide.
For developers and researchers, our API allows you to collect this data directly using any programming language, enabling seamless integration into your existing workflows and applications

Say goodbye to cumbersome processes and hello to streamlined efficiency. Experience the power of simplicity with the #TERRAClimateExplorer – where valuable weather data is just a few clicks away.
Contact us at info@terra-ms.com if you want to find out more, and subscribe to our newsletter to ensure you don’t miss any of our posts and articles.
#TERRAModelingServices