Why is soil moisture important?
Soil moisture is a key factor in crop growth and plays a critical role in crop monitoring. When soil moisture falls below critical thresholds during sensitive crop growth stages, the risk of crop failure increases. Therefore, monitoring soil moisture in major agricultural production areas is essential for accurately estimating crop performance.
Several products provide regularly updated soil moisture data with global coverage, supporting real-time monitoring and better decision-making for commodity trading and crop (re-)insurance. These datasets are typically derived from satellite observations, ground sensors, and physical climate models, each bringing different strengths to agricultural drought monitoring, as the following comparison of three key soil moisture sources illustrates.
Comparison of three different soil moisture data sources
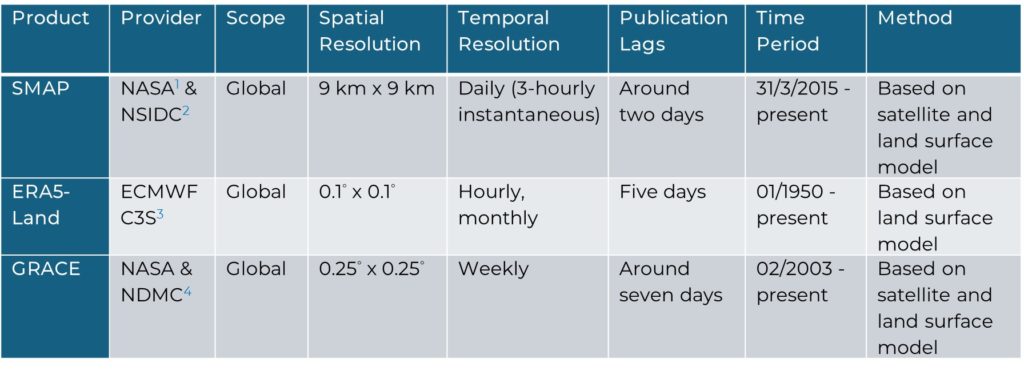
Considering temporal and spatial coverage, resolution, and publication lag, SMAP, ERA5-Land, and GRACE are reliable and consistent data sources for agricultural soil moisture monitoring. Their key specifications are summarized in Table 1.
SMAP (Soil Moisture Active Passive)
The SMAP Level 4 (L4) Root Zone Soil Moisture product, developed by NASA, provides estimates of soil moisture for the top 1 meter of soil column. SMAP satellite measures the natural microwave radiation emitted by the Earth’s surface; wetter soils emit less microwave energy than drier soils due to water’s dielectric properties. These satellite observations of surface soil moisture are integrated with a land surface model through data assimilation. The model is driven by meteorological forcing data, primarily precipitation fields corrected using global ground-based daily data from the NOAA Climate Prediction Center, and represents land-surface process such as vertical soil-moisture exchange between surface and root-zone reservoirs. Together, these components generate spatially and temporally consistent root-zone soil moisture estimates.
The microwave wavelengths used by SMAP allow penetration through clouds and moderate vegetation cover, enabling soil moisture retrieval under partially vegetated and cloudy conditions. However, SMAP shows reduced accuracy over frozen soils, densely vegetated regions, and heavily irrigated areas (see the case study for China below). In addition, the NOAA global ground-based precipitation data used to force the model for the SMAP product has limited coverage in tropical regions, which may further affect data quality. Another major limitation of SMAP is its relatively short record (available since 2015), making it less suitable for long-term analysis. Nonetheless, SMAP is still commonly used for soil moisture validation in many conditions.
ERA5-Land (ECMWF Reanalysis 5th Generation)
ERA5-Land is a global land-surface reanalysis dataset produced by the European Centre for Medium-Range Weather Forecasts (ECMWF), which is a replay of the land component of the ERA5 climate reanalysis. It provides hourly volumetric soil-water-content data at multiple depths with high spatial (~9 km) resolution. These soil-water estimates are generated using land-surface models forced by ERA5 meteorological fields, such as precipitation, air temperature, and surface pressure, which are derived from a comprehensive climate modeling system that assimilates extensive satellite and ground-based observations worldwide, together with soil property and topographic data to simulate precise soil water structure.
Since ERA5-Land is generated from a single simulation driven by ERA5, rather than assimilated from dedicated satellite observations like SMAP or GRACE, it provides a temporally consistent dataset with higher time resolution. In contrast, a single satellite typically observes a given location only once or twice per day, which limits temporal resolution. With records extending back to 1950, ERA5-Land is well suited for long-term climatological analysis. However, as a model-based reanalysis product, it may exhibit systematic biases, including wet biases in certain tropical and temperate regions (see the case study for France below).
GRACE (Gravity Recovery and Climate Experiment)
The GRACE-based product used here refers to weekly mean root-zone soil moisture drought indicators for the top 1 meter of soil. It is generated using a land-surface model that assimilates gravity-based terrestrial water storage observations from NASA GRACE and GRACE-FO satellites, which detect small variations in Earth’s gravity field due to total water storage anomaly. The root-zone soil moisture is then indirectly derived from the model partitioning. This approach contrasts with SMAP, which directly estimates soil moisture by measuring the microwave energy emitted from the soil surface.
The land surface model used in the GRACE-based products is forced by long-term meteorological datasets from ECMWF, incorporating both ground- and satellite-based observations (e.g., precipitation, temperature, and solar radiation). The model produces root-zone soil moisture estimates and climate background (1948-2012). Drought indicators are expressed as percentiles of the reference period, where lower values indicate drier-than-normal conditions and higher values indicate wetter-than-normal conditions.
The GRACE product provides global coverage and is therefore valuable for drought monitoring. However, its main limitations are the relatively coarse temporal (weekly) and spatial resolution (0.25°, approximately 25 km at the equator). In addition, the GRACE-based root-zone soil moisture estimates are derived from model-based partitioning of terrestrial water storage, which may limit their precision for agricultural monitoring, particularly at local scales.
Furthermore, the GRACE product expresses soil moisture as percentiles relative to a fixed reference period (1948–2012). As a result, in regions that have experienced relatively drier conditions in the past decade, such as Saskatchewan, Canada, the product may indicate persistent and intensified drought signals, even when recent conditions are not exceptionally severe.
The following chapters compare the three soil moisture sources using real-world case studies across major agricultural regions relevant to international (re-)insurance: Canada, Brazil, Argentina, France, and China. All five regions suffered severe droughts between 2021 and 2023, causing substantial agricultural losses and significant impacts on the (re-)insurance industry.”
Case Study for Canada
In 2021, an extreme severe drought affected the Canadian Prairies, significantly reducing both arable crop and forage production, which led to CAD 2.6 billion of total paid insurance indemnities and 375% of net loss ratio for the provincial crop insurance program in Saskatchewan [1], Canada’s most important crop-producing province.
All three datasets show consistent patterns (Figure 1). At the start of the year, soil moisture levels were close to the historical average (reference period for SMAP and ERA5: 2015–2025). From April onward, all datasets indicate a marked decline that persisted throughout the growing season. Minor recoveries are visible in June and September, but overall conditions remained significantly drier than average.
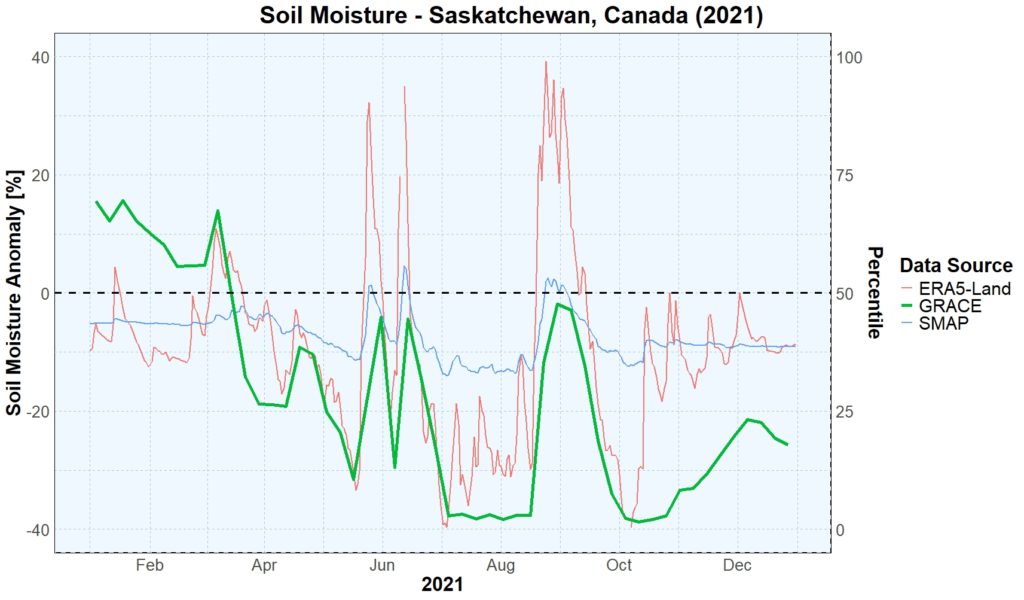
Although the datasets exhibit a similar overall pattern, they differ in volatility. This highlights the importance of comparing patterns across multiple datasets rather than focusing solely on the absolute value from one single data source, given their differing underlying characteristics (see Table 1).
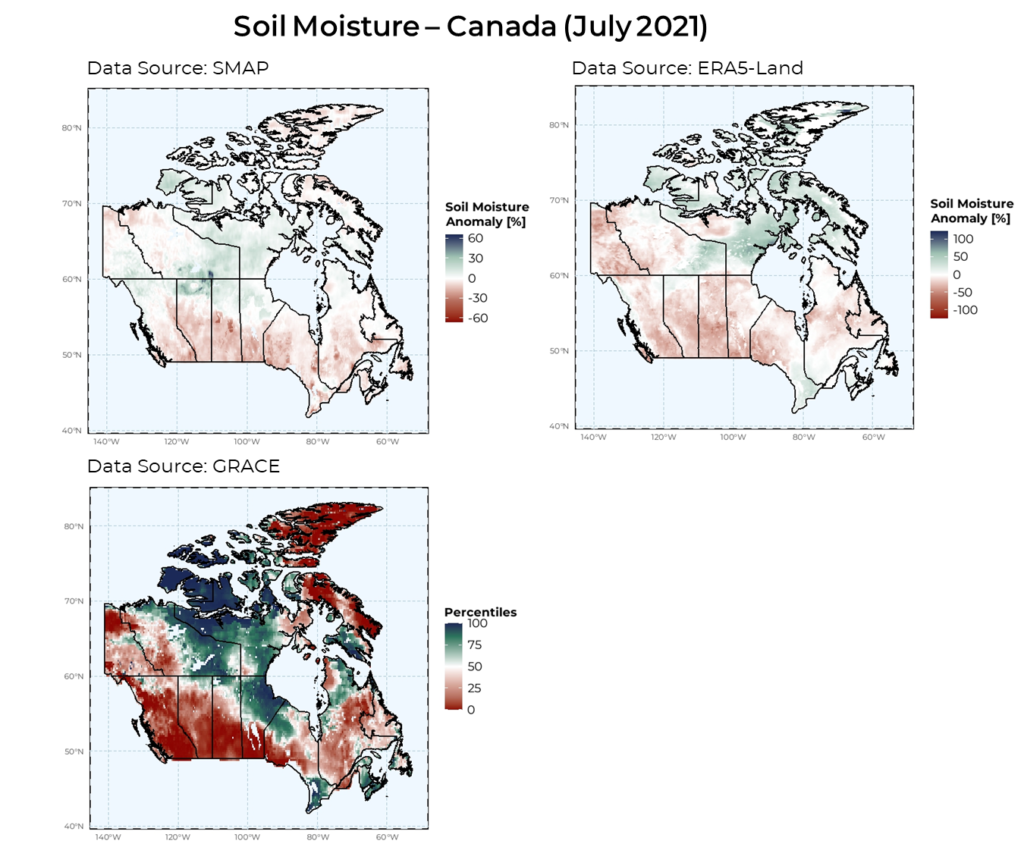
The soil moisture anomaly maps (see Figure 2) show below-average conditions across most of the Canadian Prairies during July of 2021, a critical period for crop development in Canada. While the three datasets display some spatial differences, all three datasets consistently indicate exceptionally low soil moisture levels in southern Canada.
It is important to note that the GRACE dataset does not provide direct soil moisture measurements; instead, it represents a drought indicator based on percentile rankings relative to the 1948–2012 period. Given the bounded range of soil moisture and its limited occurrence of extreme outliers under typical conditions, percentile-based metrics inherently amplify relative differences among observations more than anomaly-based approaches. This explains why drought conditions in 2021 appear significantly more severe in the GRACE dataset compared to SMAP and ERA5, which use anomalies calculated against their respective reference periods.
2021/2022 Drought in Brazil
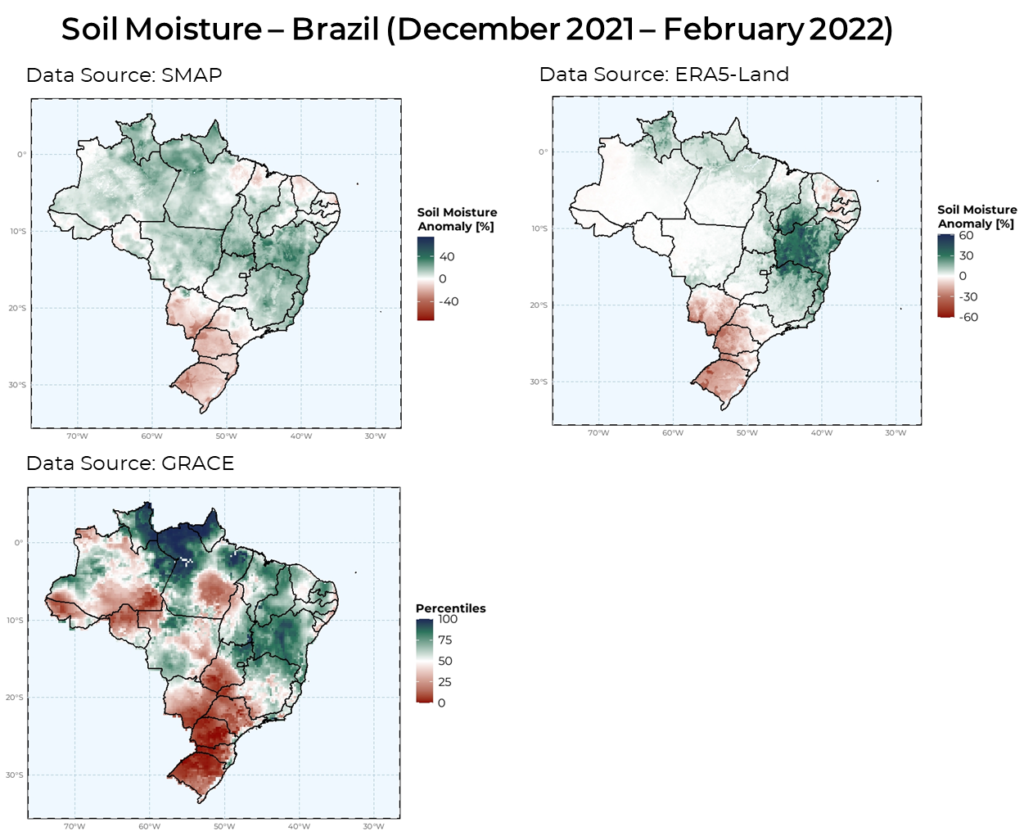
Southern Brazil is the most important agricultural production region in for the country. During the 2021/2022 growing season, it experienced its most severe agricultural drought in the past three decades, causing major yield losses for soybean, corn, and wheat.
The 2021/2022 drought resulted in BRL 7.7 billion (around USD 1.5 billion) of insurance payouts in the first half of the year [2]. Consequently, the nation’s agricultural GDP declined by 8% in the first quarter of 2022 [3].
All three soil moisture sources correctly capture drought conditions in southern Brazil (Figure 3). As observed and explained in the previous case study from Canada, again, GRACE shows the strongest signal during the 2021 drought due to the characteristics of the percentile data. Notably, only GRACE indicates drought conditions in the Goiás and Amazon regions. In contrast, SMAP and ERA5 show near-zero anomalies relative to the 2015–2025 baseline, suggesting that soil moisture during this period was close to average in these regions.
2022/2023 Drought in Argentina
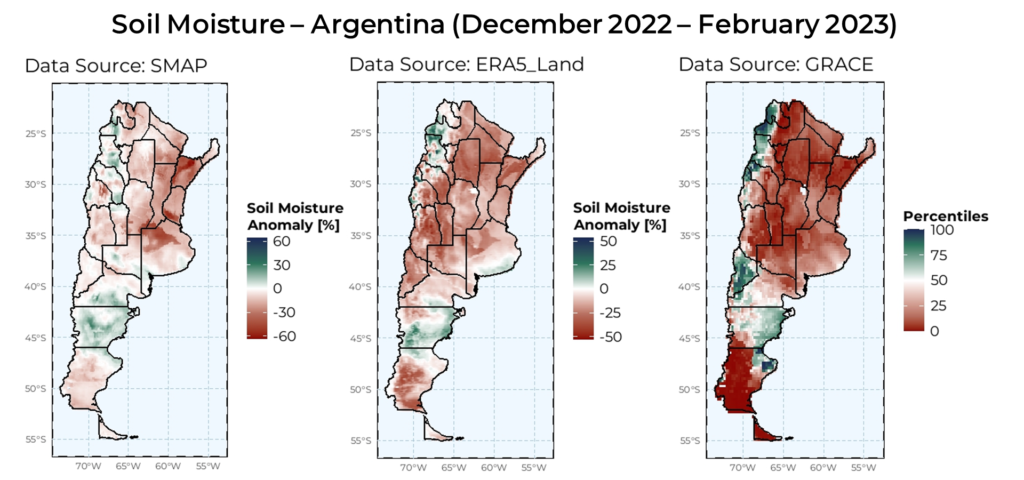
In Argentina, the severe 2022/2023 drought reduced soybean production by around 40%, resulting in an estimated USD 8 billion loss for soybean-related commodities exported in 2023 [4]. The most affected areas are clearly reflected in the soil moisture maps (Figure 4).
The main soybean-producing provinces (Buenos Aires, Córdoba, and Santa Fe) are in central and northeastern Argentina and show pronounced dryness across all three datasets. Overall, the spatial patterns are largely consistent among the datasets, except in Neuquén Province. In this province, both SMAP and ERA5-Land indicate relatively dry conditions, while GRACE points to wetter-than-normal soil moisture. Because much of Neuquén is characterized by arid and desert environments, its inherently low soil moisture makes it highly sensitive to small changes in water storage. This sensitivity, combined with differences in temporal reference periods among the datasets, likely explains the observed discrepancies.
2022 Drought in France
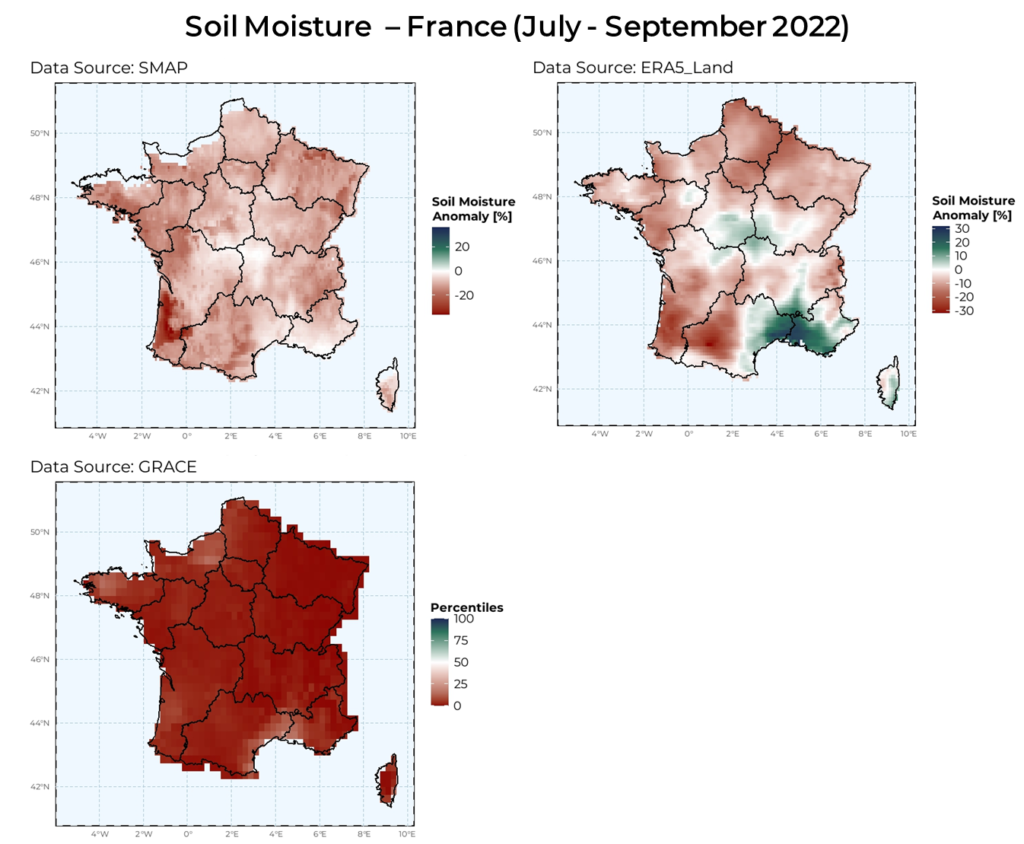
In 2022, France experienced its driest summer in 50 years, with widespread negative soil moisture anomalies across the country (Figure 5). Cereals and forage crops were most severely affected, with a loss ratio of 130% [5]. Total claims under multi-risk climate crop insurance (MRC) reached €407 million, largely driven by the exceptional drought [5].
GRACE indicates strong drought conditions, with below-average soil moisture across nearly the entire country. SMAP shows a broadly similar spatial pattern, though with differences in magnitude. In contrast, ERA5-Land, despite using the same reference period as SMAP, suggests relatively wet conditions in southeastern and central France, whereas SMAP shows near-zero or slightly negative anomalies in these regions.
These differences highlight the discrepancies among datasets. As a reanalysis product developed by ECMWF, ERA5-Land has been reported to exhibit a wet bias in certain regions [6]. Moreover, the underlying ECMWF land-surface model has been shown to overestimate soil moisture in southern France [7]. This may explain the higher soil moisture levels indicated by ERA5-Land in this region during 2022.
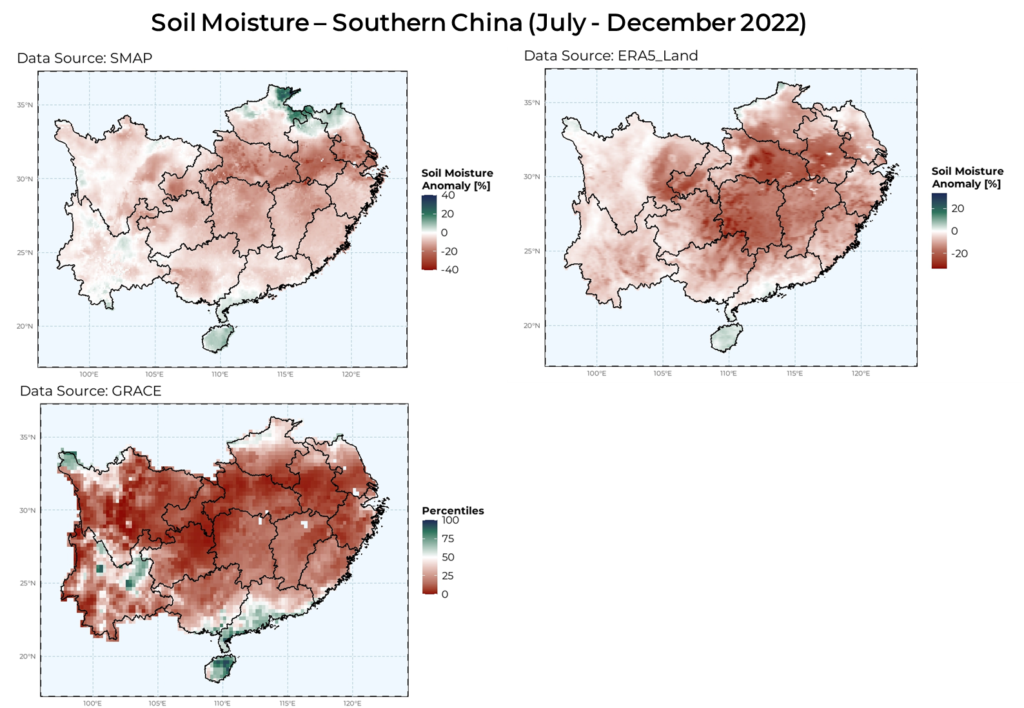
2022 Drought in China
In southern China, a drought beginning in July 2022 marked the most severe climate event in the Yangtze River Basin (the most important rice production region in the country) since 1961, resulting in around USD 4.75 billion of agricultural losses [8]. All three datasets consistently capture this signal (Figure 6) but with spatial differences.
SMAP and ERA5-Land both highlight drought conditions in the eastern part of the basin, while GRACE additionally indicates severe drought in Sichuan in the western basin. SMAP shows slightly wetter conditions in the northeastern parts of the whole area (Northern Henan, Anhui, and Jiangsu), which isn’t observed in ERA5-Land nor in GRACE. The higher surface soil moisture detected by SMAP in these areas may be partly attributable to irrigation rather than natural precipitation, as all three provinces are heavily irrigated and were less severely affected by the 2022 drought [9].
By contrast, ERA5-Land is a model-based reanalysis product that relies heavily on meteorological forcing, such as precipitation and temperature. Consequently, it may better reflect meteorological drought conditions, particularly in extensively irrigated regions where surface soil moisture observations can be influenced by human water management practices.
Conclusions
SMAP, ERA5-Land, and GRACE all effectively detect global soil moisture conditions and major drought events. However, it is important to recognize the distinct characteristics of these soil moisture products, each exhibiting different temporal and spatial stability patterns and biases (Table 2). Due to its percentile-based formulation, GRACE shows larger fluctuations. In contrast, SMAP and ERA5-Land generally provide more stable estimates, with SMAP offering finer spatial resolution but a shorter temporal record.
Nonetheless, significant differences in volatility persist even between SMAP and ERA5-Land. For example, a -20% soil moisture anomaly can correspond to different drought severities across datasets: for ERA5-Land, it may indicate slightly below-average conditions, while for SMAP it can represent extreme drought. Therefore, it is essential to understand the historical context and baseline characteristics of each soil moisture dataset and region under analysis, to properly interpret prevailing conditions with a long-term perspective.
Given the distinct methodological limitations and characteristic differences across these products, reliance on a single dataset for global soil moisture monitoring may result in incomplete or potentially misleading assessments, particularly in agricultural insurance and reinsurance applications, where accurate risk evaluation is critical.
We therefore strongly recommend a multi-product approach that integrates the complementary strengths of SMAP, ERA5-Land, and GRACE, precisely the approach implemented in TERRA ClimateExplorer.
TERRA ClimateExplorer offers an interactive dashboard for comprehensive soil moisture analysis, integrating SMAP, ERA5-Land, and GRACE within a single, intuitive interface. All datasets are updated with minimal lag, enabling near–real-time monitoring and timely decision-making. Users can easily compare multiple data sources in seconds, gaining a more complete and globally consistent view of soil moisture conditions.
With worldwide coverage and multi-product insights, TERRA ClimateExplorer is ideally suited for agricultural insurers and reinsurers seeking to strengthen risk assessment, enhance portfolio monitoring, and support more informed underwriting decisions across major agricultural regions.
Reference
[1] Saskatchewan Crop Insurance Corporation (SCIC), 2022.
[2] Ministry of Agriculture and Livestock, Brazil, 2022.
[3] Bad weather knocks down Brazil’s grain production as ‘exhaustively forewarned. Mongabay, 2022.
[4] FAOSTAT, 2026.
[5] L’assurance agricole en 2022. France Assureurs, 2023.
[6] Lal, P., Singh, G., Das, N. N. et al. Assessment of ERA5-Land volumetric soil water layer product using in situ and SMAP Soil Moisture observations. IEEE Geoscience and Remote Sensing Letters 19, 1-5 (2022).
[7] Jach, L., Fluhrer, A., Bauer, H-S. et al.. Comparing temporal dynamics of soil moisture from remote sensing, modeling, and field observations across Europe. Remote Sensing 18(3), 445 (2026).
[8] Ministry of Emergency Management of People’s Republic of China, 2022.
[9] Zhu, L., Wu, H., Li, M., Dou, C., & Zhu, A.-X. Estimation of irrigation water use by using irrigation signals from SMAP Soil Moisture data. Agriculture 13(9), 1709 (2023).
Want to run your own crop or weather analysis?
With the #TERRAClimateExplorer, accessing agro-meteorological insights has never been easier. The #TERRAClimateExplorer is a web-based solution that enables you to gather, monitor, and visualize historical and real-time weather and remote sensing data for any location worldwide. For developers and researchers, our API allows you to collect this data directly using any programming language, enabling seamless integration into your existing workflows and applications  Say goodbye to cumbersome processes and hello to streamlined efficiency. Experience the power of simplicity with the #TERRAClimateExplorer – where valuable weather data is just a few clicks away. Contact us at info@terra-ms.com if you want to find out more, and subscribe to our newsletter to ensure you don’t miss any of our posts and articles. #TERRAModelingServices