The Indian Ocean Dipole (IOD) is quietly reshaping rainfall patterns across Africa, Australia, and Asia, yet most people have never heard of this powerful climate driver. While El Niño garners headlines, the IOD operates as an equally important but less commonly known force that can trigger devastating droughts, catastrophic floods, and influence weather patterns across three continents. This oceanic seesaw between the waters off East Africa and Indonesia has emerged as a critical piece of the climate puzzle, particularly as extreme events like the record-breaking 2019 positive phase demonstrate its capacity to reshape entire growing seasons and water cycles. Unlike the more familiar Pacific Ocean phenomena, this pattern operates on its own timeline and follows distinct mechanisms that can either complement or completely override other climate influences.
Phases of the IOD
The Indian Ocean Dipole operates as a massive oceanic oscillation, with temperatures alternating between the western Indian Ocean near the African coast and the eastern region near Indonesia and Australia (Fig. 1). Its severity is measured as the Indian Ocean Dipole Mode Index (DMI), which is determined by the difference of sea surface temperature anomaly between the western and eastern Indian ocean. When this index exceeds certain thresholds for at least three consecutive months, meteorologists declare an official IOD event.
During the neutral phase, temperatures remain relatively balanced across the Indian Ocean. Pacific Ocean water flows naturally between Indonesian islands, maintaining warm seas northwest of Australia. Air rises above these warm waters and descends over the western Indian Ocean, creating steady westerly winds along the equator. This balanced state typically produces normal rainfall patterns across the region.
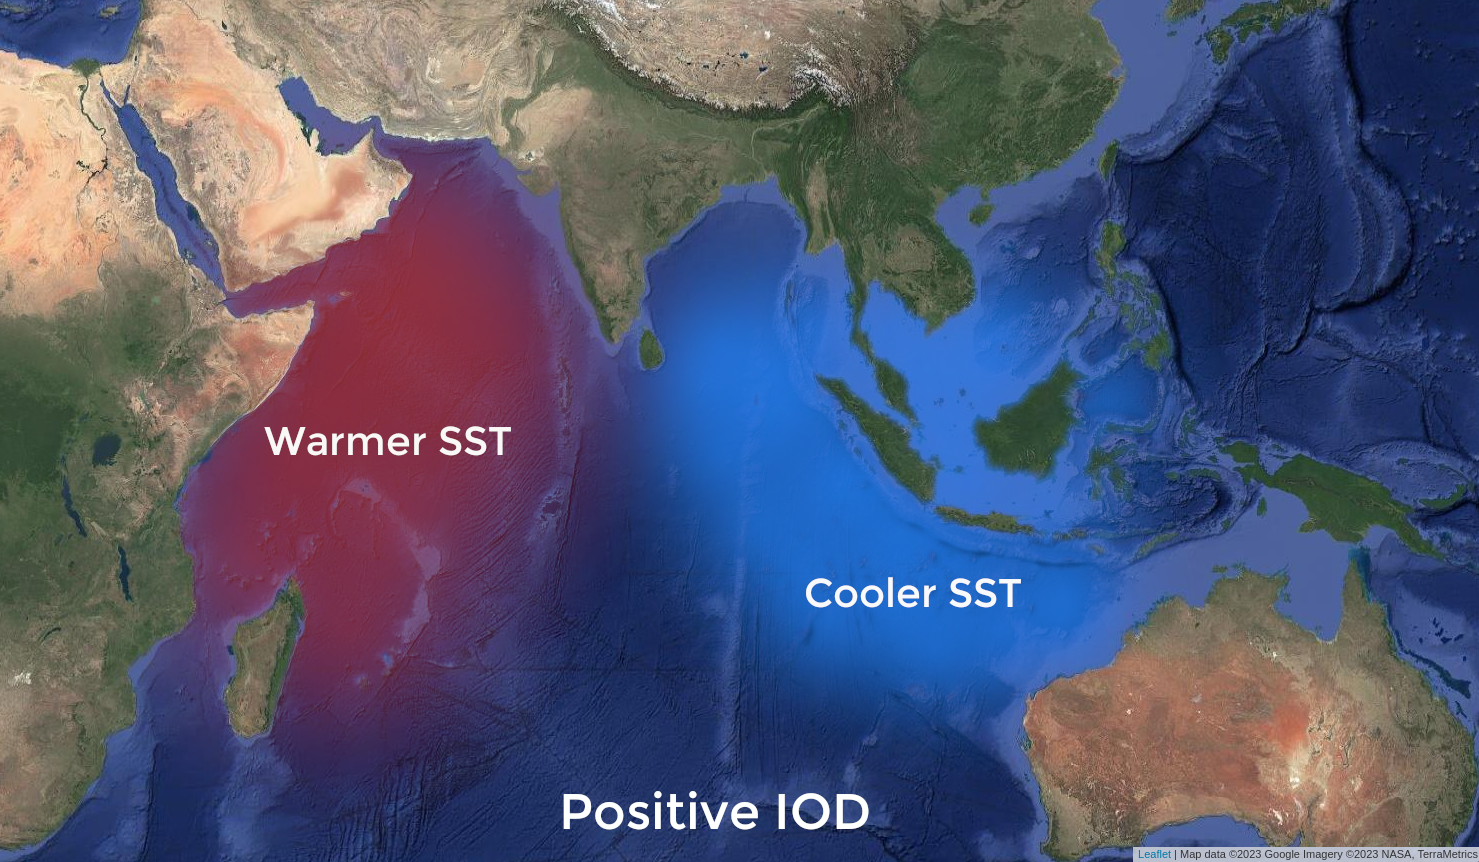
The positive phase (DMI > 0.4°C, Fig. 1) transforms this equilibrium dramatically. Westerly winds weaken along the equator, allowing warm water to shift toward Africa while cool water rises from the deep ocean in the east. This creates a stark temperature contrast: waters near Madagascar become significantly warmer while seas near Indonesia turn cooler and drier. The result is reduced atmospheric moisture northwest of Australia, fundamentally altering the path of weather systems and typically producing less rainfall across Australia and Indonesia during winter and spring.
The negative phase (DMI < -0.4°C) reverses this pattern again. Westerly winds intensify along the equator, concentrating warmer waters near Australia and Indonesia. Cool waters dominate the western Indian Ocean, creating enhanced moisture availability for Australian weather systems and typically producing above-average rainfall across southern Australia.
The IOD follows a seasonal cycle, typically developing between April and May, reaching peak intensity during September and October, then rapidly decaying when monsoon circulation arrives around November. This timing makes the IOD particularly influential for agricultural planning, as events generally coincide with critical growing seasons across multiple continents.

Impacts
The most recent phases of the IOD have had significant impacts on the surrounding regions, contributing to severe droughts and altering rainfall patterns. 2019 experienced one of the strongest years on record with a DMI reaching 2°C in October-November. This event surpassed even the notorious 1997 extreme positive IOD while being immediately followed by consecutive years of negative IOD (Fig. 2).
Positive IOD event 2019
The 2019 event demonstrated IOD’s capacity for independent operation from ENSO cycles. While previous extreme IOD events like 1997 occurred alongside strong El Niño conditions, the 2019 extreme developed during neutral ENSO conditions [1], proving that IOD can generate its own extreme climate impacts without Pacific Ocean influence.
In Australia, the positive IOD contributed substantially to the warm and dry conditions that preceded the devastating Black Summer bushfire season. High air temperatures and reduced precipitation in October and November led to severely depleted soil moisture content (Fig. 3), creating the dangerous conditions that would fuel one of Australia’s most catastrophic fire seasons [5].
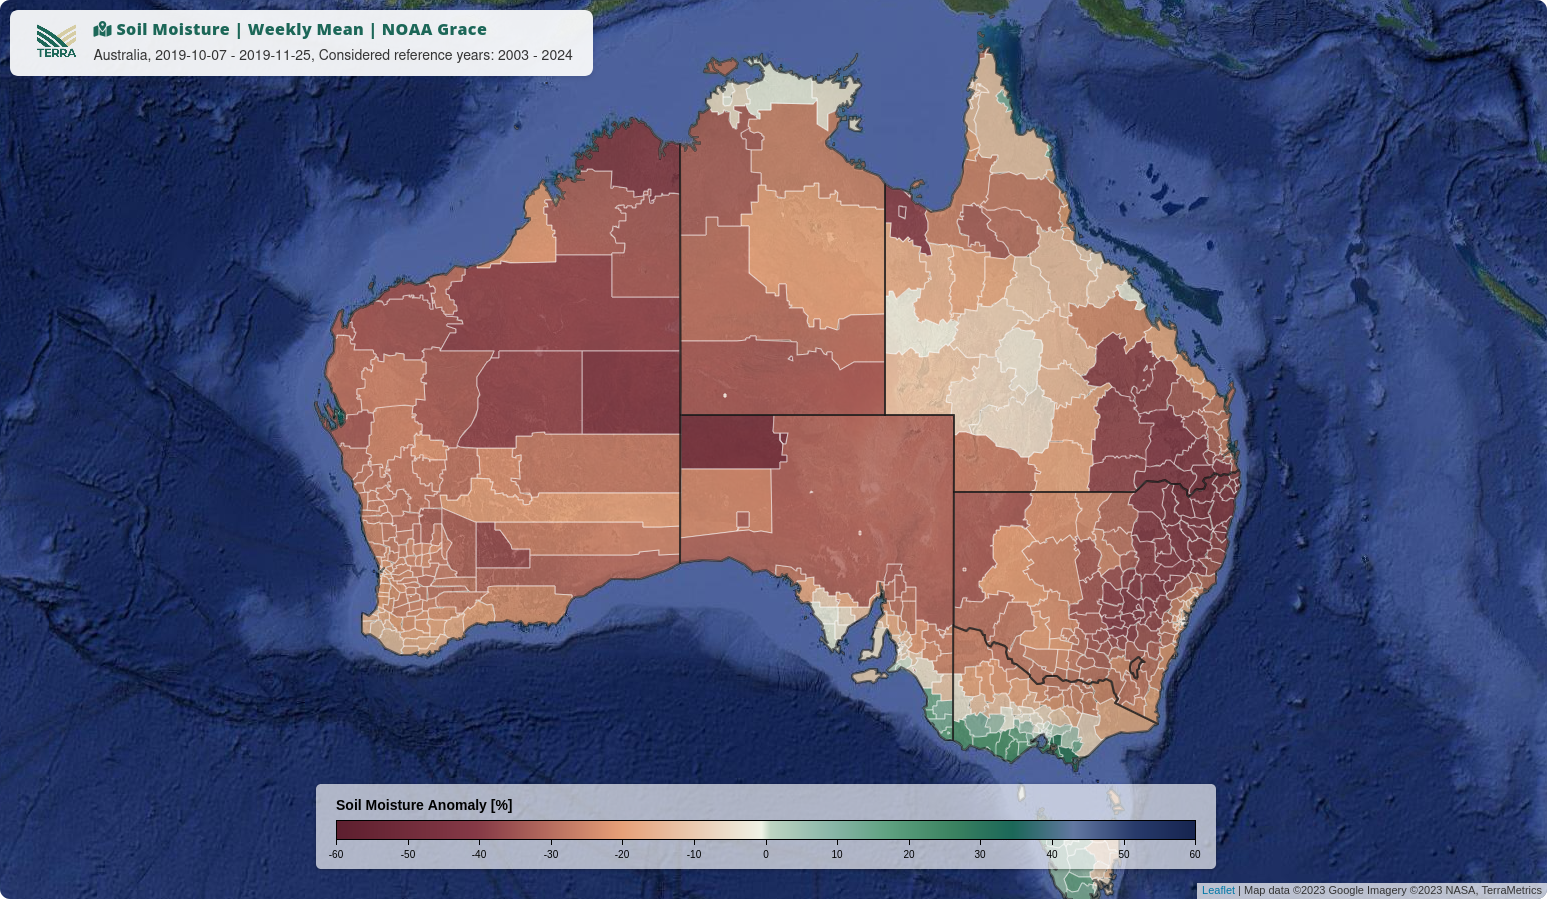
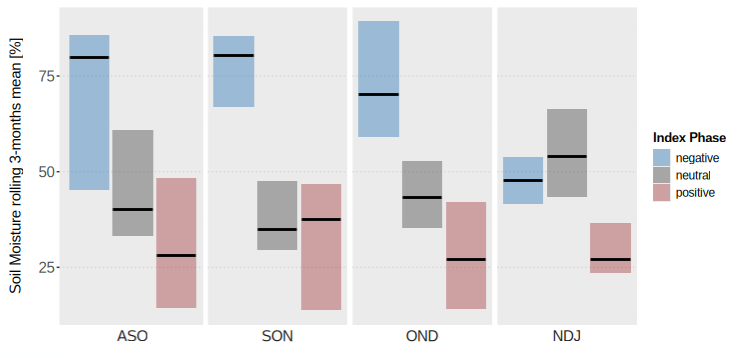
Analyzing the correlation between soil moisture and the phases of the IOD (Fig. 4) in the TERRA ClimateExplorer we see significant trends for low soil moisture in positive phases of the IOD while in neutral and negative phases the opposite is apparent.
Across Indonesia and Southeast Asia, the pattern brought heavily reduced rainfall from September to November 2019, exacerbating drought conditions and contributing to widespread agricultural stress. In stark contrast, the Horn of Africa and much of the Indian subcontinent experienced significant positive rainfall anomalies, demonstrating how the IOD acts as a true oceanic seesaw—lifting one region while depressing another [2] (Fig. 5).

Negative IOD event 2021 – 2022
Following the extreme 2019 positive IOD, the Indian Ocean swung into negative territory, creating a stark contrast that demonstrated the IOD’s capacity for rapid transitions between opposing states. The negative IOD persisted through much of 2021 and 2022, coinciding with a rare triple La Niña event that amplified its impacts across the Indian Ocean basin. While the negative IOD typically brings reduced rainfall to East Africa, the 2021-2022 event coincided with broader climate patterns that created devastating consequences [6] (Fig. 6). The Horn of Africa experienced its worst drought in over 40 years, with multiple consecutive failed rainy seasons from October 2020 to early 2023. More than 30 million people across Ethiopia, Kenya, and Somalia faced drought-related food insecurity, around 10 million livestock were reported dead, with Somalia alone seeing 6.7 million people affected by the drought emergency as of 2023 [7].
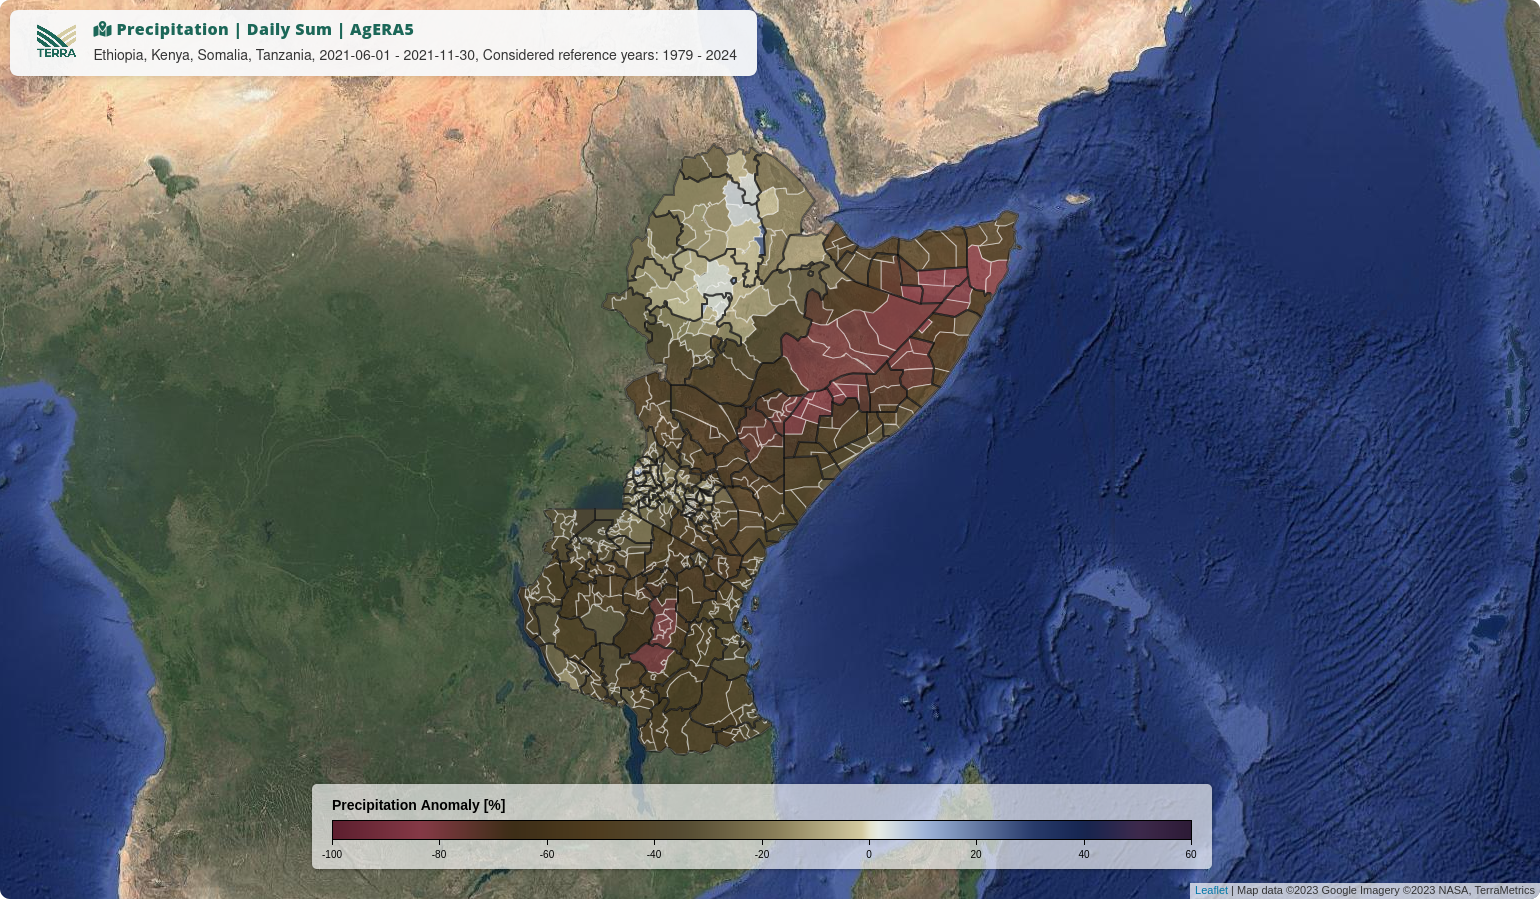
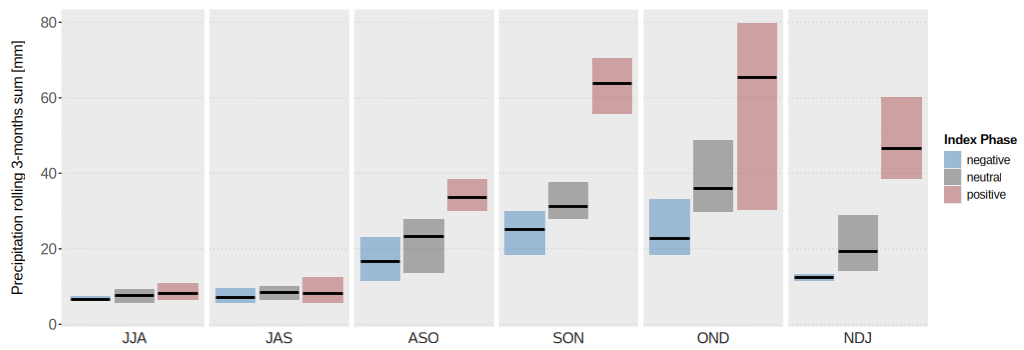
Adding to the catastrophe, the drought was followed by heavy rainfall, leading to multiple flooding events in the region. This pattern of strong dependence on the IOD can be confirmed by correlating its phases with precipitation in Somalia (Fig. 7), where we can observe below-average precipitation for years with a negative IOD and significantly elevated precipitation during positive IOD events.
On the opposite side of the Indian Ocean, Australia experienced some of its wettest conditions on record (Fig. 8). The triple La Niña and negative IOD combination created strong flooding events across eastern Australia, with the March 2021 floods forcing thousands of people to evacuate and Sydney experiencing its worst flooding in 60 years.
November 2021 became Australia’s wettest November on record, while the February 2022 floods devastated southeastern Queensland and northeastern New South Wales. With saturated soils and full catchments from continuous rainfall, there was nowhere for new water to go except across the landscape, wiping out 120,000 hectares of wheat crops around Moree alone [9] .

Forecast for 2025
Starting the year with weak negative conditions, the IOD developed into weak positive conditions in the first half of 2025. Forecasts from the National Oceanic and Atmospheric Administration (NOAA) [10] and the Japan Agency for Marine Earth Science and Technology (JAMSTEC) [11] both expect neutral conditions throughout June, July and August with models predicting an increased likelihood of negative IOD conditions for the rest of the year. With the El Niño–Southern Oscillation (ENSO) expected to stay neutral until the end of the year [12], we might expect typical impacts associated with weak negative IOD conditions as discussed in this article: less moisture in the west and more moisture in the east of the Indian Ocean.
Take-away
The IOD’s influence on global weather patterns will likely intensify as Indian Ocean warming accelerates. The western Indian Ocean is warming at faster rates than the eastern regions, potentially creating more frequent positive IOD conditions [8]. This warming pattern could fundamentally alter the balance of global atmospheric circulation, affecting monsoon systems, drought patterns, and extreme weather frequency across multiple continents. Research suggests we may already be witnessing this transformation. Climate models project not only more frequent extreme IOD events but also stronger peak intensities, meaning future positive IODs could surpass even the record-breaking 2019 event.
Modern satellite technology and ocean monitoring systems now allow us to track IOD development months in advance, offering crucial lead time for agricultural planning and disaster preparedness. The ocean’s temperature patterns may seem distant from daily life, but events like 2019 demonstrate how quickly these abstract measurements can translate into very real consequences for communities, ecosystems, and economies across the globe.
The #TERRAClimateExplorer
With the #TERRAClimateExplorer, accessing agro-meteorological insights has never been easier. The #TERRAClimateExplorer is a web-based solution that enables you to gather, monitor, and visualize historical and real-time weather and remote sensing data for any location worldwide.

Say goodbye to cumbersome processes and hello to streamlined efficiency. Experience the power of simplicity with the #TERRAClimateExplorer – where valuable weather data is just a few clicks away.
Contact us at info@terra-ms.com if you want to find out more, and subscribe to our newsletter to ensure you don’t miss any of our posts and articles.
#TERRAModelingServices
References
- [1] Tokyo Climate Center, Climate Prediction Division. El Niño Monitoring. URL: https://ds.data.jma.go.jp/tcc/tcc/products/elnino/index.html
- [2] , , , , & (2021). The extreme positive Indian Ocean dipole of 2019 and associated indian summer monsoon rainfall response. Geophysical Research Letters, 48, e2020GL091497. https://doi.org/10.1029/2020GL091497
- [3] World Climate Service. What is the Indian Ocean Dipole (IOD)?. URL: https://www.worldclimateservice.com/2021/09/02/indian-ocean-dipole/
- [4] Wikipedia. Indian Ocean Dipole. URL: https://en.wikipedia.org/wiki/Indian_Ocean_Dipole
- [5] BBC. Indian Ocean Dipole: What is it and why is it linked to floods and bushfires?. URL: https://www.bbc.com/news/science-environment-50602971
- [6] , , & (2025). Indian Ocean dipole impacts on Eastern African short rains across observations, historical simulations and future projections. Earth’s Future, 13, e2024EF005219. https://doi.org/10.1029/2024EF005219
- [7] Wikipedia. Horn of Africa drought (2020–2023). URL: https://en.wikipedia.org/wiki/Horn_of_Africa_drought_(2020%E2%80%932023)
- [8] , , and (2009), Climate change contributes to more frequent consecutive positive Indian Ocean Dipole events, Geophys. Res. Lett., 36, L23704, doi:10.1029/2009GL040163.
- [9] ABC News Australia. Most productive NSW agricultural shire counts hundreds of millions of dollars in crop losses. URL: https://www.abc.net.au/news/rural/2022-10-24/crop-flood-damage-estimates-north-west-nsw/101569484
- [10] National Oceanic and Atmospheric Administration (NOAA). Global Forecast Discussion May 2025. URL: https://www.cpc.ncep.noaa.gov/products/international/africa/cons_fcsts/Global_Forecasts_Discussion.pptx
- [11] Japan Agency for Marine Earth Science and Technology (JAMSTEC). Newsroom. A negative Indian Ocean Dipole Mode will occur this summer.URL: https://www.jamstec.go.jp/e/jamstec_news/20250421/
- [12] Australian Government – Bureau of Meteorology. Climate, Forecasting & monitoring, Southern hemisphere monitoring, Overview. Issued: 24 June 2025. URL: http://www.bom.gov.au/climate/enso/?ninoIndex=nino3.4&index=nino34&period=weekly