Winter Wheat Production in the United States
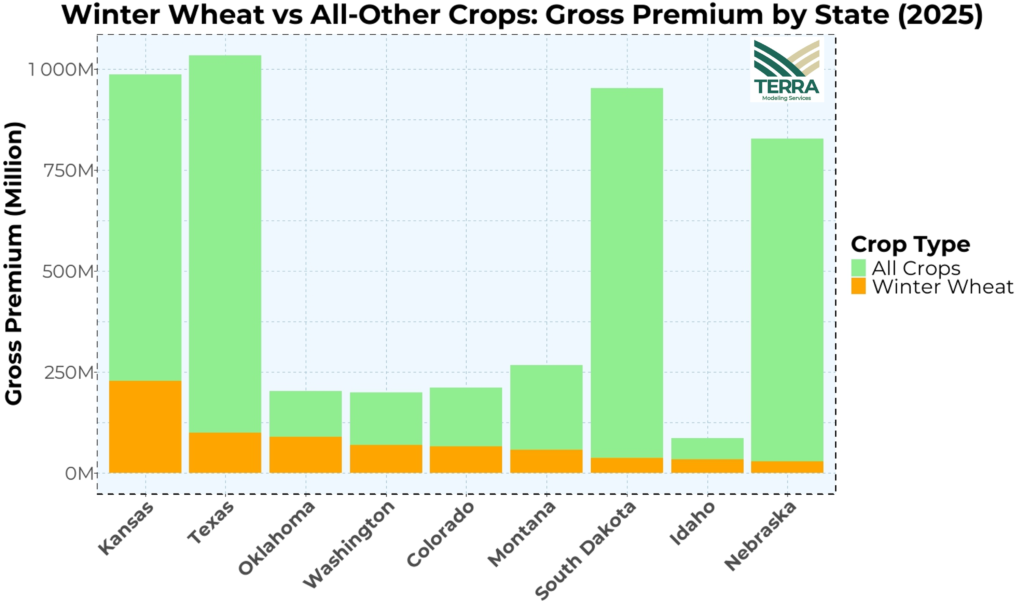
Winter wheat represents a significant share of U.S. crop insurance exposure. Across the Great Plains and many Southern states, winter wheat accounts for over 20% of total gross premium in yield-based and revenue-based insurance products. In Oklahoma, this figure reaches nearly 50% of total federal crop insurance premium (Figure 1).
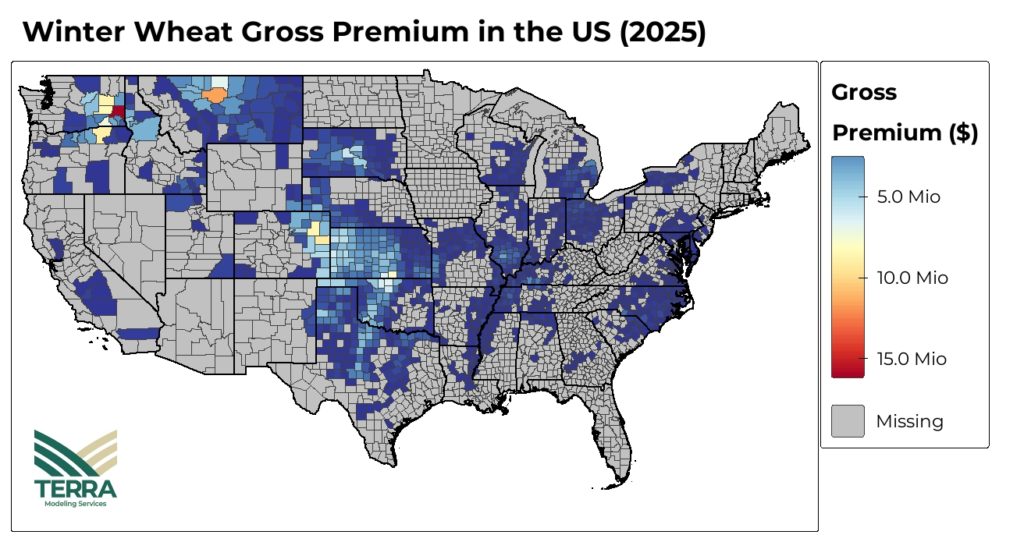
The majority of winter wheat production in the U.S., along with the associated insurance gross premiums, is concentrated in the Great Plains region. This geographic concentration creates specific risk exposure patterns that are critical for insurance portfolio management (Figure 2).
Regional Planting Variability and Winter Wheat Development
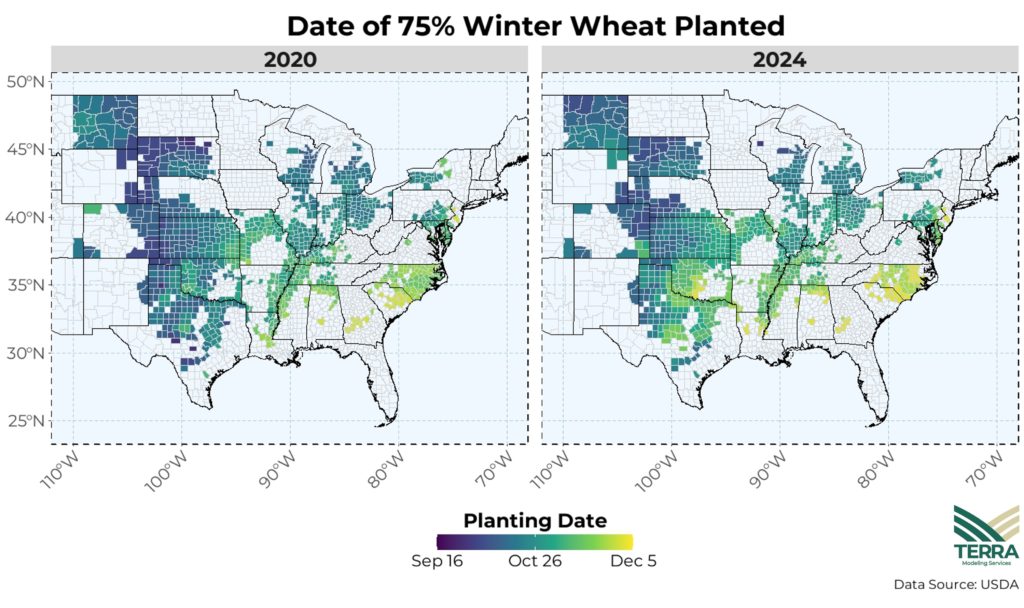
Winter wheat planting dates vary dramatically by region and year, ranging from mid-September in the Western Great Plains to early December in the Southeast (Figure 3). This variability is critical for predictive modeling: weather variables cannot be evaluated using fixed calendar dates across all regions and years. Instead, models must reference weather conditions relative to each county’s actual planting date to capture the true risk during the crop establishment period.
After planting, winter wheat seedlings overwinter in a dormant state. Exposure to cold temperatures for a sufficient period, a process called vernalization, is essential for winter wheat to transition from vegetative growth to reproductive development, and flowering in the spring. Without adequate vernalization, winter wheat yields decrease significantly.
Prediction of End of Season Gross Loss Ratios with Winter Soil Moisture
Soil moisture at planting is a critical factor influencing winter wheat yields and insurance outcomes. This analysis quantifies the relationship between soil moisture at planting-time and end-of-season insurance losses.
Our approach combines USDA planting progress data with daily soil moisture indicators from the TERRA ClimateExplorer, to determine actual county-level planting dates and evaluate field conditions during the critical establishment period for each location and year.
Figure 4 shows counties where soil moisture at planting-time has a statistically significant impact on final loss ratios, revealing a clear East-West divide:
Western counties (dry regions): Higher soil moisture at planting improves yield potential, leading to lower loss ratios.
Eastern counties (wet regions): Higher soil moisture at planting increases crop failure risk, leading to higher loss ratios.
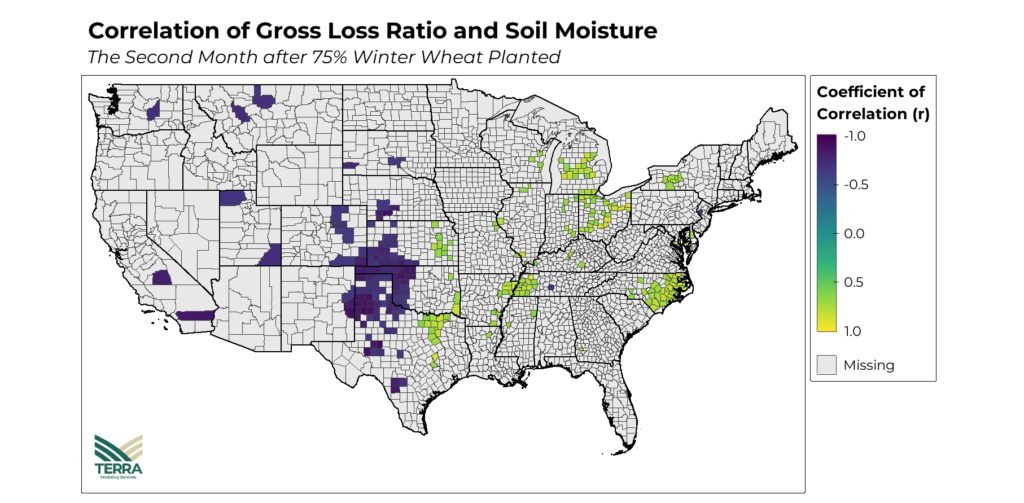
Figure 5 illustrates this pattern for Western counties, where insufficient soil moisture during the second month after planting substantially increases both crop failure risk and final loss ratios.
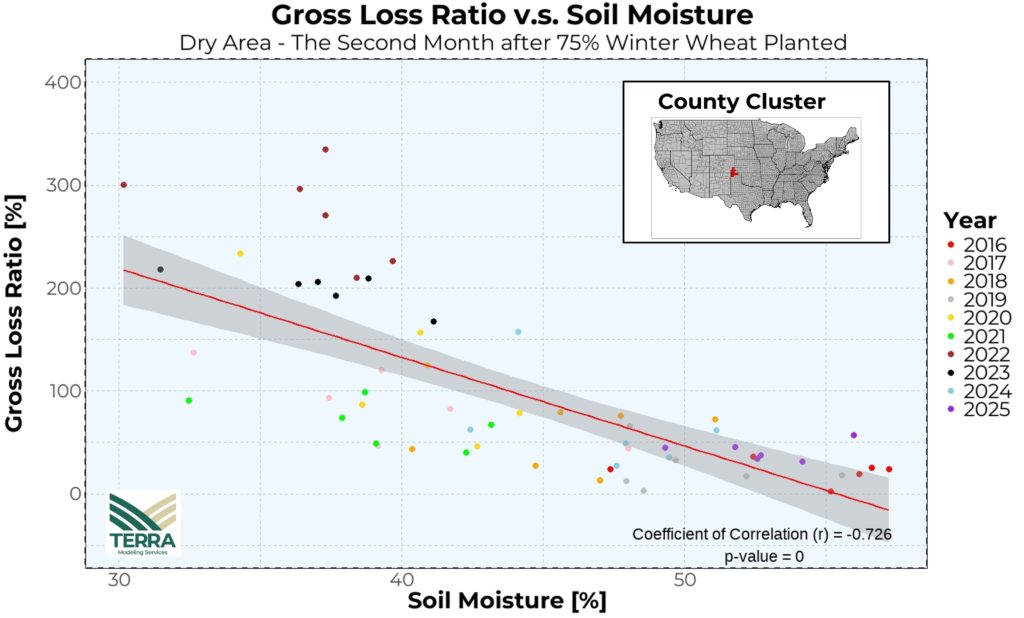
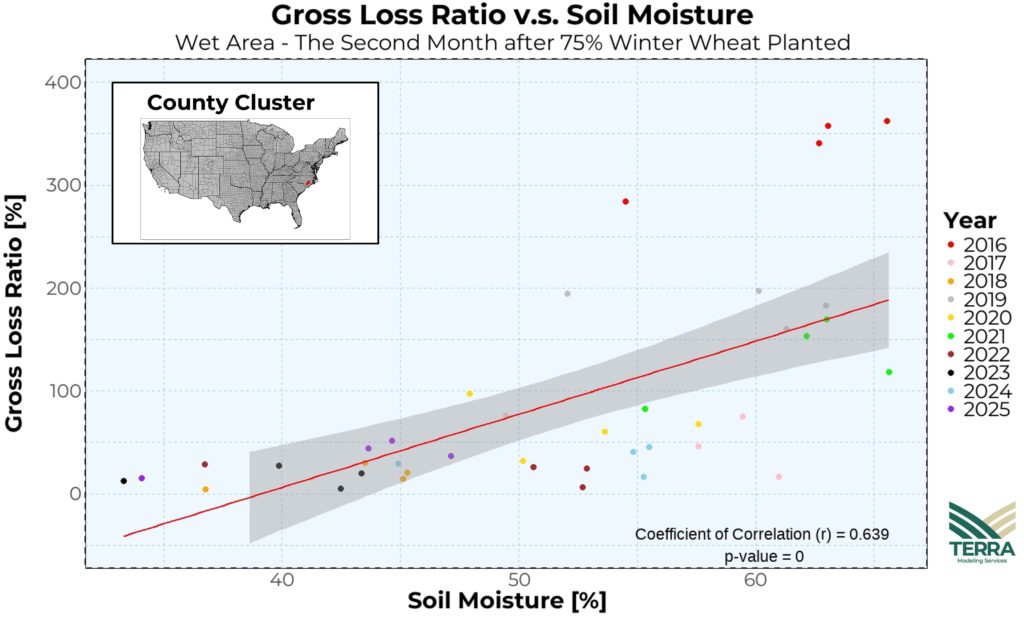
Figure 6 demonstrates the opposite pattern observed in Eastern counties, where higher soil moisture during establishment increases crop stress and insurance losses. This positive correlation indicates that excessive moisture in wetter regions creates unfavorable conditions that elevate final gross loss ratios, for winter wheat.
This spatial pattern signals that optimal soil moisture conditions for winter wheat establishment vary by region. The contrasting relationships between soil moisture and loss ratios across the East-West divide underscore the importance of location-specific climate intelligence for accurate risk assessment. Understanding these regional dynamics enables insurers and reinsurers to refine their underwriting strategies and portfolio management, based on actual field conditions during the critical establishment period.
How TERRA ClimateExplorer Strengthens Your 2026 Underwriting Decisions:
Winter wheat insurance outcomes can be predicted for the core production region in the Great Plains with high accuracy within weeks after planting. TERRA ClimateExplorer delivers daily, county-level soil moisture data in near-real time. Combined with USDA weekly planting progress reports, this enables early risk assessment and more responsive portfolio management during the critical early-season period. This capability provides direct value to U.S. crop insurers for fund allocation of winter wheat policies, and to reinsurers for enhanced risk evaluation of their clients’ crop portfolios.
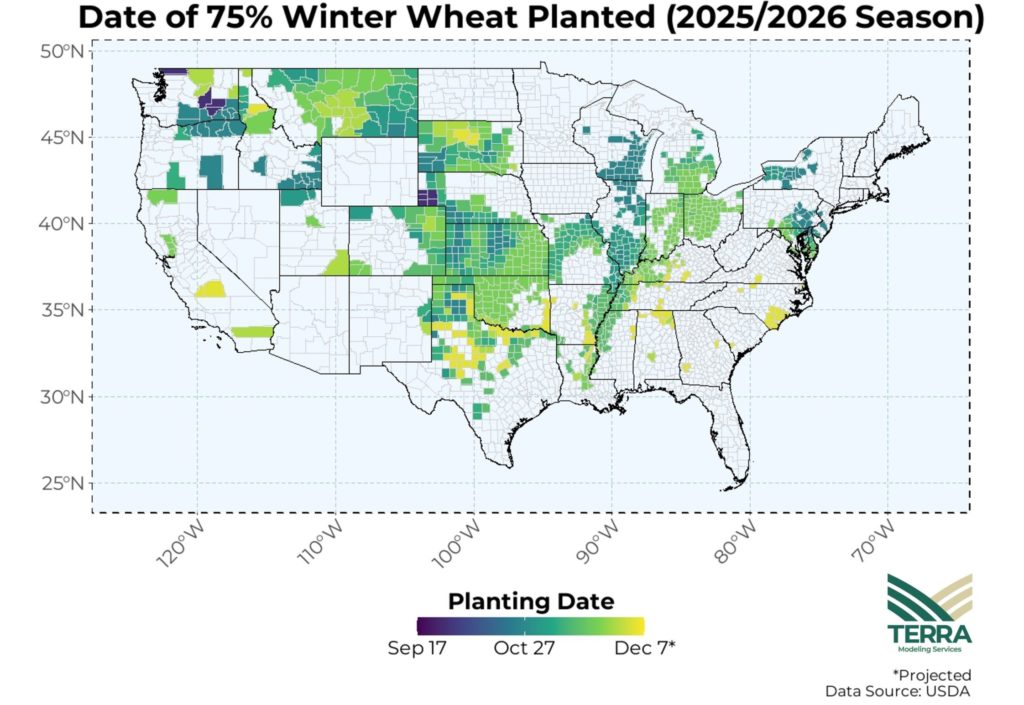
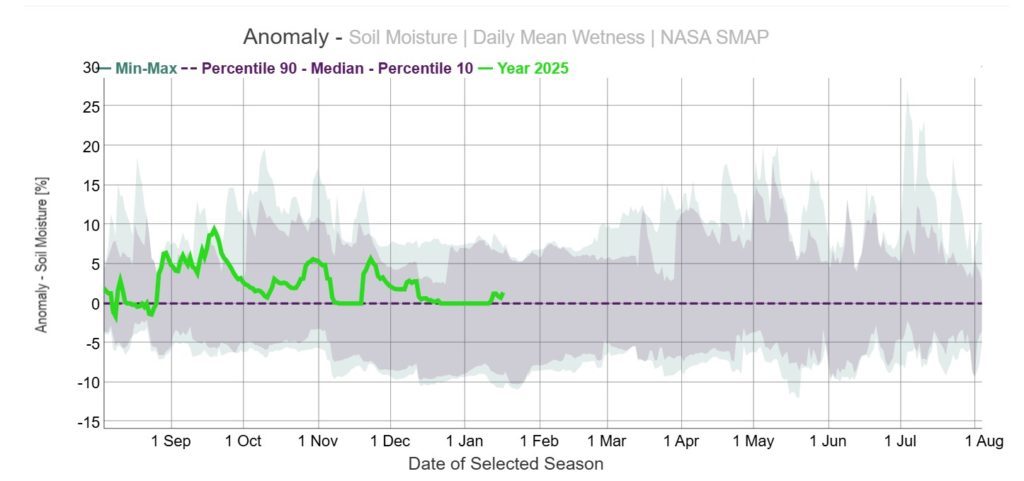
Winter wheat planting for the 2026 harvest year is now complete (Figure 7). TERRA ClimateExplorer soil moisture data (Figure 8) indicates generally favorable establishment conditions across the core winter wheat region of Southwestern Kansas. The outlook for winter wheat in this region is positive, as soil moisture has remained above historical average from December through January, substantially reducing the risk of crop failure for the 2025/2026 growing season (Figure 9).
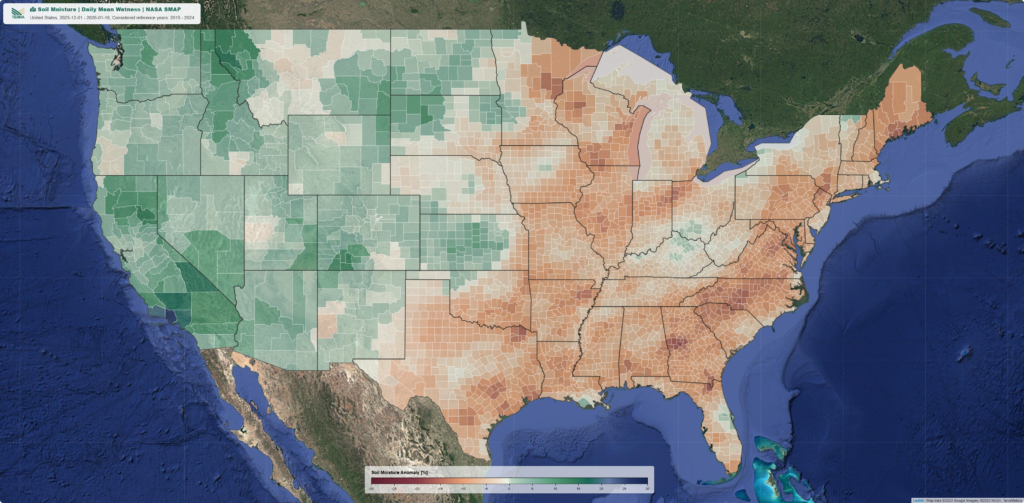
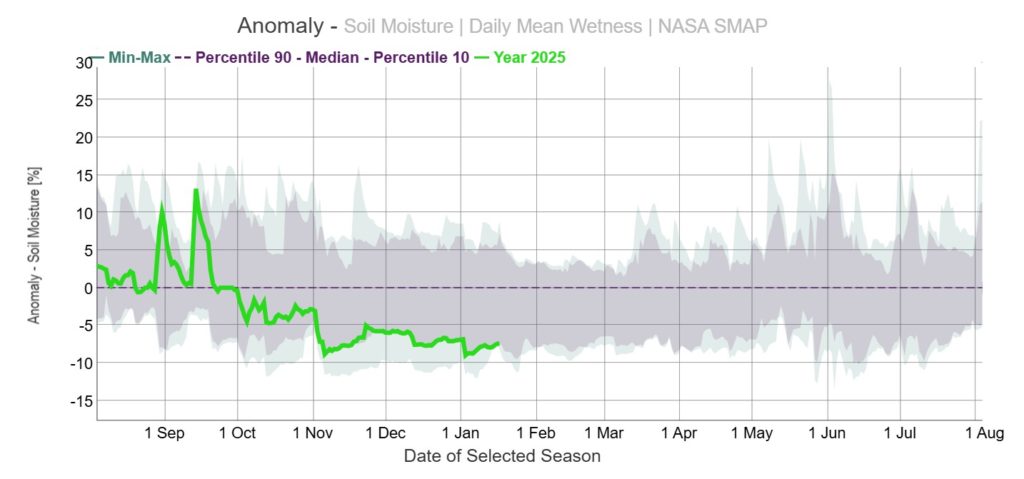
In contrast to Southwestern Kansas, Northern Texas has been experiencing significantly below-average soil moisture since fall 2025. Seasonal analysis for this region finds soil moisture levels below historical averages from October 2025 through mid-January 2026 (Figure 10), increasing the risk of insurance payouts if dry conditions persist through the critical establishment period.
Conclusion
Using statistical methods and TERRA ClimateExplorer soil moisture data, we achieve highly accurate predictions of winter wheat gross losses across U.S. counties in the core production region. Our approach demonstrates that timely, high-resolution climate data is more valuable than complex modeling for early-season risk assessment. Current conditions from December 2025 to mid-January 2026 indicate elevated risk for Northern Texas if below-average soil moisture persists through the critical winter establishment period.
Want to run your own crop or weather analysis?
With the #TERRAClimateExplorer, accessing agro-meteorological insights has never been easier. The #TERRAClimateExplorer is a web-based solution that enables you to gather, monitor, and visualize historical and real-time weather and remote sensing data for any location worldwide. For developers and researchers, our API allows you to collect this data directly using any programming language, enabling seamless integration into your existing workflows and applications  Say goodbye to cumbersome processes and hello to streamlined efficiency. Experience the power of simplicity with the #TERRAClimateExplorer – where valuable weather data is just a few clicks away. Contact us at info@terra-ms.com if you want to find out more, and subscribe to our newsletter to ensure you don’t miss any of our posts and articles. #TERRAModelingServices